
Data Testing & Mapping
In Search of the Truth.
Before a business or project can be modelled, it must first ensure that the numbers are real. Data Testing & Mapping is the essential process of converting raw organizational "noise" into the high-quality signals required for the Business by Numbers framework. Here are a couple of techniques we use for building confidence in the data.
The Mapping Mandate
In the Business by Numbers system, data is viewed as the "DNA of business"—a continuous record of every transaction and interaction. However, raw data is often fragmented, siloed, or decayed.
Ensuring Integrity
Our Data Testing & Mapping protocol provides a structured methodology to bridge this gap. We don't just collect data; we map your internal metrics directly to the 10 Determinants of Success, identifying where your information is robust and where "data defficiency" is creating strategic risk.
By testing for accuracy, reliability, and consistency at the source, we ensure that your insights and decision-making is rooted in a single, verified version of the truth.
Proven Statistical Methods
There are many formulas in our library that can be used to measure the integrity, accuracy and suitability of the data for analysis - Our workflow engine helps decide which ones are the most productive for the application in hand.
Some examples follow...
The Error of Your Ways
To move from observation to understanding, we apply specific mathematical tests to evaluate the integrity of your data streams:
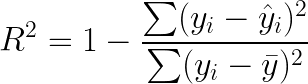
The R squared Integrity Test
We use the coefficient of determination to measure how well your reported data actually explains the variance in your business outcomes. A low R^2 indicates that the data you are using to lead your business is "noisy" and lacks predictive power.
The Formula
Getting to the Root of the Mean Problem
This formula is utilized during the mapping phase to quantify the error between your internal reporting and real-world results. It allows us to "stress-test" your data, ensuring that the metrics fed into the Business by Numbers engine are within acceptable thresholds for strategic execution.
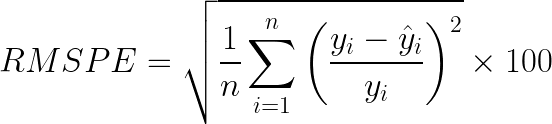
Root Mean Square Percentage Error
The Root Mean Square Percentage Error (RMSPE) is a diagnostic metric used in the Business by Numbers project to measure the accuracy of financial or operational forecasts.
Unlike standard error measurements, RMSPE calculates the square root of the average of the squared percentage differences between predicted values and real-world outcomes.
By focusing on percentage deviations, it provides a scale-independent view of data integrity, penalizing larger outliers more heavily to ensure that strategic mapping remains precise.
Essentially, it identifies the "noise" in your data streams, quantifying the percentage of error you must account for before a number can be trusted for decision-making.
The Formula
Using Root Mean Squared Percentage Error to test data
Example for 3 scenarios
This example shows the result of a routine data check against data applied in one of three scenarios. The tolerance of "noisy" data changes from application to application - This test is often run behind the scenes to produce a digital "insight" that helps understand risk.
The project might sound great but if the underlying data is "flaky" then the decision risk might not be mitigated.